Displaying Grids in the Browser Debugger
When working with grids during the layout of a website, it is sometimes necessary to check how correctly the elements are placed in the grid. In addition, if we have made a mistake, we must figure out which element is causing the incorrect placement. For this purpose, we can use the debugger in the browser.
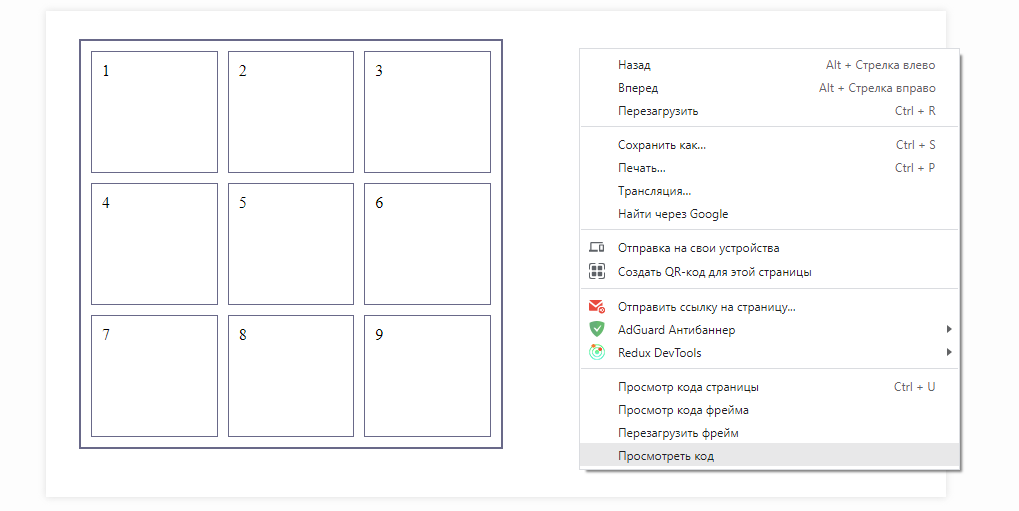
Let's look at the grid using the debugger in the Chrome browser as an example. First, select the grid object we are interested in and right-click to select the 'View code' option from the list:
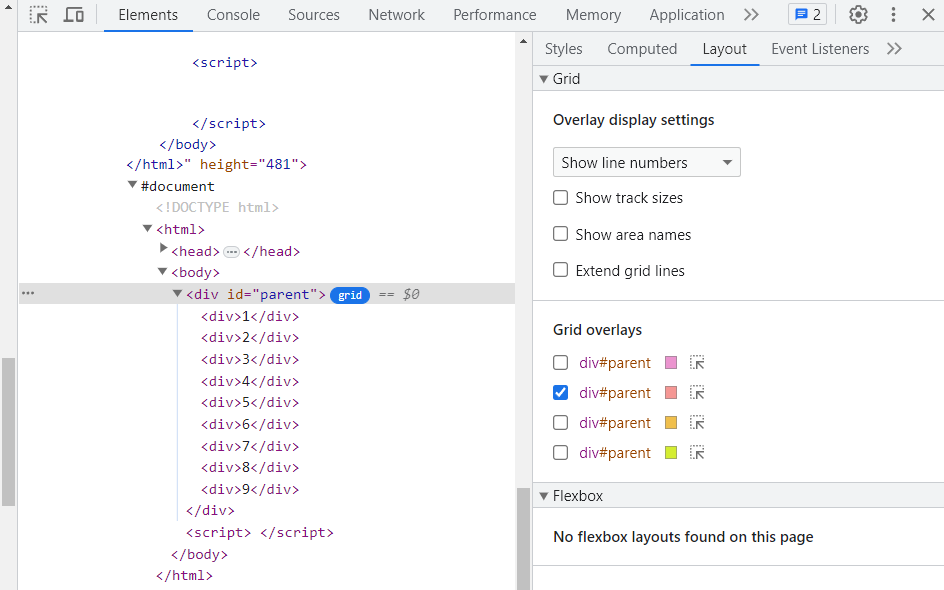
Now, in the browser panel that opens on the right, hover the cursor over our grid object and notice that in the line next to the parent element there is a button grid:
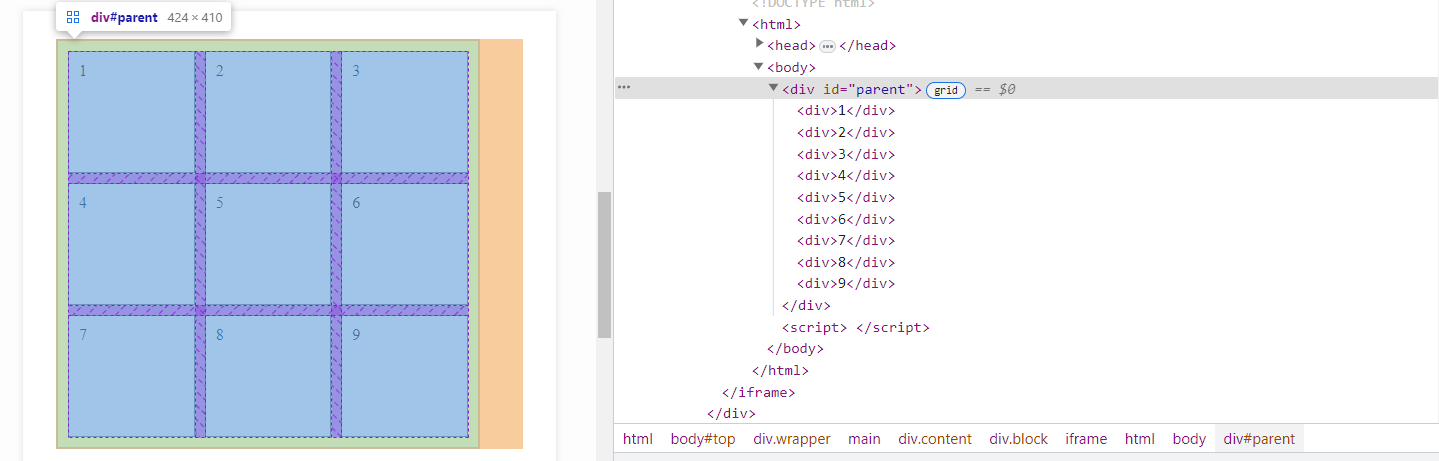
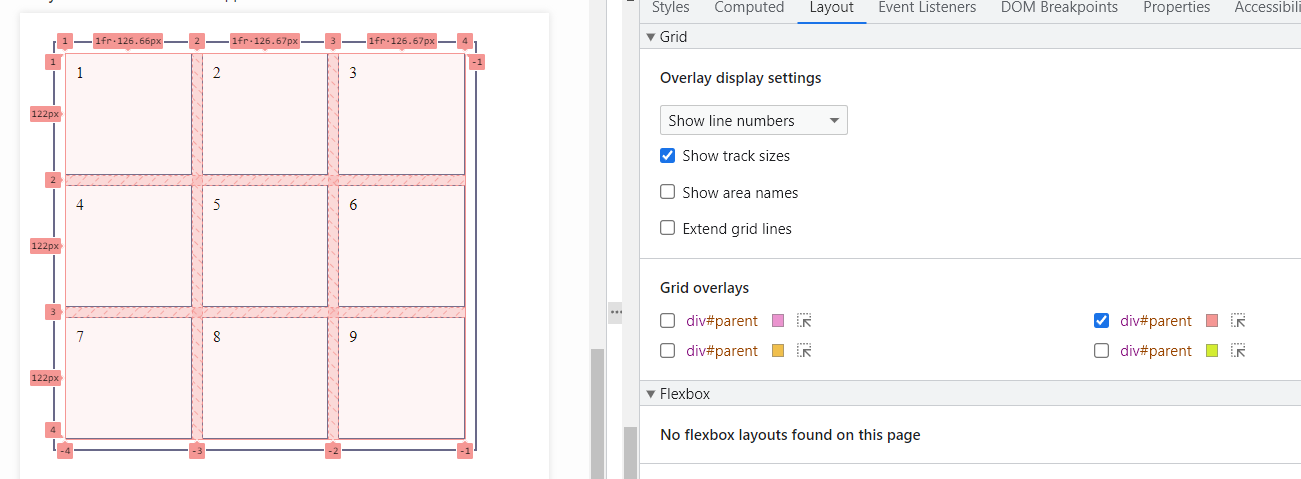
After clicking on the grid button, we will see that our object is displayed in a visually understandable grid system, with the numbering of all columns and rows indicated:
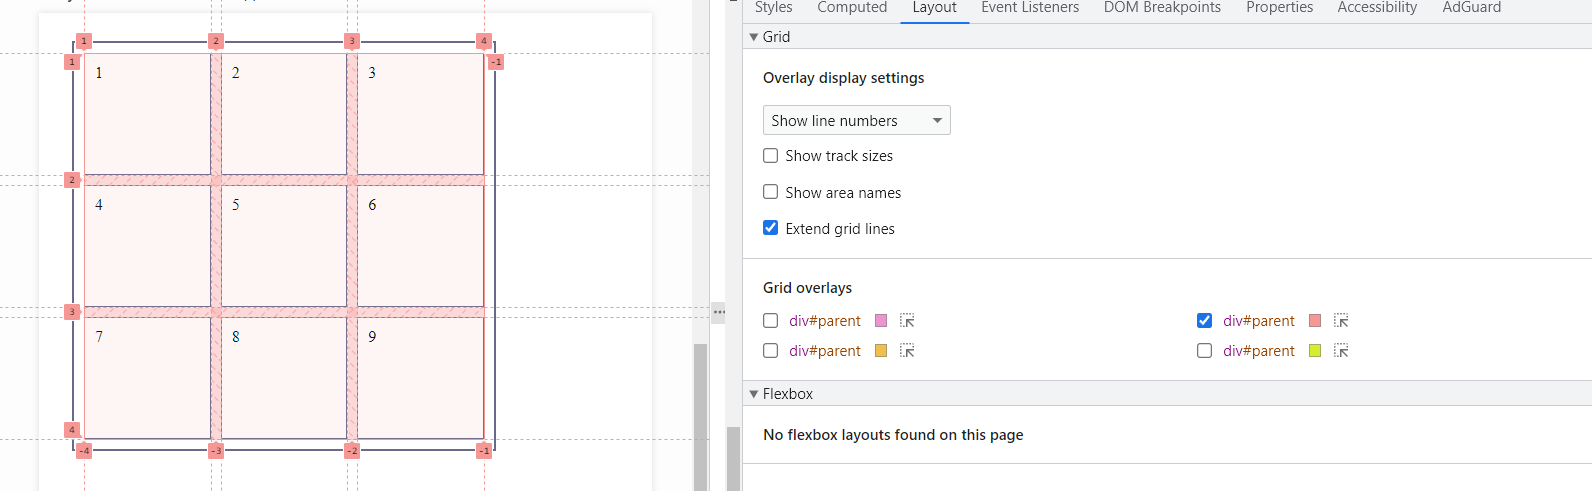
Now take a look at the panel in the debugger. It contains tabs Styles, Computed, Layout, and more. Switch from the Styles tab, which is active by default, to the Layout tab. You will see a list of your grid settings:
Let's select the first option to display Show track sizes, which shows the size of the tracks:
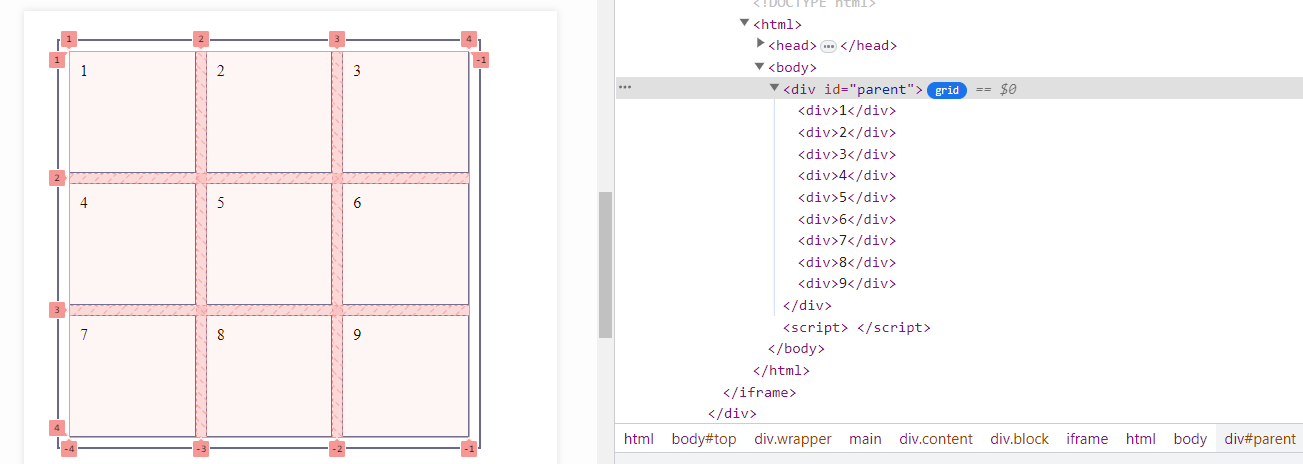
C With the Show area names option, you can display the names of grid areas if they are specified. And by selecting the Extend grid lines option, we will see track lines extended beyond the grid: